McEwen Reports Attractive Gold Intercepts at Grey Fox; Results Support Resource Growth Ahead of Upcoming Resource Estimate; Gibson: 10.1 g/t Gold Over 5.8 m (25GF-1597) and 10.4 g/t Gold Over 5.6 m (25GF-1564), GFS: 4.8 g/t Gold Over 14.9 m (25GF-1575)
TORONTO, Sept. 02, 2025 (GLOBE NEWSWIRE) -- McEwen Inc. (NYSE: MUX) (TSX: MUX) (“McEwen”, "MUX") is pleased to report that drilling at Fox Complex’s Grey Fox Project continues to deliver attractive gold grades and widths. These results from the Gibson Expansion Zone and Grey Fox South (GFS) support resource growth ahead of an updated resource estimate expected in October 2025.
Strategic Highlights
- Consistent High-Grade Results: Drilling continues to deliver attractive gold grades and demonstrate continuity across key zones, including Gibson Expansion and GFS.
- Resource Growth Potential: New intercepts illustrate the potential for near-term resource expansion, building on the current Grey Fox resource of 1,538,000 gold ounces at 3.64 g/t Au Indicated and 458,000 gold ounces at 3.30 g/t Au Inferred.
-
Exploration Outlook: Geological similarities with large regional deposits, such as Canadian Malartic, reinforce Grey Fox’s growth potential.
- Upcoming Milestone: Updated Grey Fox resource estimate scheduled for October 2025.
Drilling Highlights from Two Key Gold Zones at Grey Fox – Gibson & GFS
| Area | Hole ID |
Gold Grade (g/t) |
True Width (m) |
Notes |
| Gibson | 25GF-1597 | 10.1 | 5.8 | High-grade vein, good continuity |
| 25GF-1564 | 10.4 | 5.6 | Within the Gibson Expansion Zone | |
| GFS | 25GF-1575 | 4.8 | 14.9 | Broad mineralized zone |
| 25GF-1549 | 4.4 | 6.0 | Confirming mineable grades and widths | |
Project Update
The updated 3D mineralization model for Grey Fox incorporates recent intercepts and is expected to increase the forthcoming resource estimate. With mineralization remaining open and new zones demonstrating strong continuity, Grey Fox has significant potential for further resource growth and contribution to McEwen’s Ontario operations. This potential is further supported by geological parallels with major regional deposits, such as Canadian Malartic located near Val d’Or, Quebec, where similar host rocks and depositional environments have yielded large-scale, long-life gold production.
“We are delighted to have four key projects driving our gold mining business in both the near and long term. Exploration drilling on our Fox Complex, specifically Grey Fox, continues to exceed expectations, while underground development at our Stock Mine and Froome West is progressing well. We are also encouraged by the potential of our Nevada projects, where drilling will provide further exploration updates.
Our development work at the Stock Mine and Froome West positions us to increase gold production and lower costs in 2026, while Grey Fox remains our key project for long-term growth. With gold performing exceptionally well, our gold-focused projects and operations put McEwen in a strong position to take advantage of higher prices. Our goal over the next few years is clear: to grow annual output beyond 200,000 gold ounces and reduce production costs, generating stronger margins,” said Rob McEwen, CEO and Chief Owner.
A detailed drill results table, supporting figures, and geological discussion are provided in the Appendix to this press release, following the Investor Relations and Social Media section.
Technical Information
Technical information pertaining to the Fox Complex exploration contained in this press release has been prepared under the supervision of Sean Farrell, P.Geo., McEwen Ontario’s Exploration Manager, who is a Qualified Person as defined by SEC S-K 1300 and Canadian Securities Administrators National Instrument 43-101 "Standards of Disclosure for Mineral Projects."
The technical information related to resource and reserve estimates in this press release has been reviewed and approved by Luke Willis, P.Geo., McEwen’s Director of Resource Modelling and a Qualified Person as defined by SEC S-K 1300 and Canadian Securities Administrators National Instrument 43-101 "Standards of Disclosure for Mineral Projects."
New analyses reported herein were submitted as ½ core samples and assayed by the photon assay method at the accredited laboratory MSA Labs (ISO 9001 & ISO 17025) in Timmins, Ontario, Canada.
ABOUT MCEWEN
McEwen Inc. provides its shareholders with exposure to gold, copper and silver in the Americas by way of its producing mines in USA, Canada and Argentina and its large advanced-stage copper development project in Argentina. It also has a gold and silver mine on care and maintenance in Mexico. Its Los Azules copper project is being developed to become one of the world’s first regenerative copper mines and carbon neutral by 2038.
Rob McEwen, Chairman and Chief Owner, has a personal investment in the companies of US$205 million and takes a salary of $1/year. He is a recipient of the Order of Canada and a member of the Canadian Mining Hall of Fame. His objective for MUX is to build its share value and establish a dividend, as he did while building Goldcorp Inc.
McEwen Inc. shares are publicly traded on the New York Stock Exchange (NYSE) and the Toronto Stock Exchange (TSX) under the symbol "MUX".
CAUTION CONCERNING FORWARD-LOOKING STATEMENTS
This news release contains certain forward-looking statements and information, including "forward-looking statements" within the meaning of the Private Securities Litigation Reform Act of 1995. The forward-looking statements and information expressed, as at the date of this news release, McEwen Inc.'s (the "Company") estimates, forecasts, projections, expectations or beliefs as to future events and results. Forward-looking statements and information are necessarily based upon a number of estimates and assumptions that, while considered reasonable by management, are inherently subject to significant business, economic and competitive uncertainties, risks and contingencies, and there can be no assurance that such statements and information will prove to be accurate. Therefore, actual results and future events could differ materially from those anticipated in such statements and information. Risks and uncertainties that could cause results or future events to differ materially from current expectations expressed or implied by the forward-looking statements and information include, but are not limited to, fluctuations in the market price of precious metals, mining industry risks, political, economic, social and security risks associated with foreign operations, the ability of the Company to receive or receive in a timely manner permits or other approvals required in connection with operations, risks associated with the construction of mining operations and commencement of production and the projected costs thereof, risks related to litigation, the state of the capital markets, environmental risks and hazards, uncertainty as to calculation of mineral resources and reserves, foreign exchange volatility, foreign exchange controls, foreign currency risk, and other risks. Readers should not place undue reliance on forward-looking statements or information included herein, which speak only as of the date hereof. The Company undertakes no obligation to reissue or update forward-looking statements or information as a result of new information or events after the date hereof except as may be required by law. See McEwen Inc.'s Annual Report on Form 10-K for the fiscal year ended December 31, 2024, and other filings with the Securities and Exchange Commission, under the caption "Risk Factors", for additional information on risks, uncertainties and other factors relating to the forward-looking statements and information regarding the Company. All forward-looking statements and information made in this news release are qualified by this cautionary statement.
The NYSE and TSX have not reviewed and do not accept responsibility for the adequacy or accuracy of the contents of this news release, which has been prepared by the management of McEwen.
|
Want News Fast? Subscribe to our email list by clicking here: https://www.mcewenmining.com/contact-us/#section=followUs and receive news as it happens!! |
| WEB SITE | SOCIAL MEDIA | |||||
| www.mcewenmining.com |
McEwen |
Facebook: | facebook.com/mceweninc | |||
| LinkedIn: | linkedin.com/company/mceweninc | |||||
| CONTACT INFORMATION | X: | X.com/mceweninc | ||||
| 150 King Street West | Instagram: | instagram.com/mceweninc | ||||
| Suite 2800, PO Box 24 | ||||||
| Toronto, ON, Canada |
McEwen Copper |
Facebook: | facebook.com/ mcewencopper | |||
| M5H 1J9 | LinkedIn: | linkedin.com/company/mcewencopper | ||||
| X: | X.com/mcewencopper | |||||
| Relationship with Investors: | Instagram: | instagram.com/mcewencopper | ||||
| (866)-441-0690 - Toll free line | ||||||
| (647)-258-0395 |
Rob McEwen |
Facebook: | facebook.com/mcewenrob | |||
| Mihaela Iancu ext. 320 | LinkedIn: | linkedin.com/in/robert-mcewen-646ab24 | ||||
| info@mcewenmining.com | X: | X.com/robmcewenmux | ||||
Appendix: Technical Data and Figures
For analysts and technical readers, the following materials are provided:
Figure 1. Fox Complex Eastern Property and Grey Fox Zones
Grey Fox Resource Overview
Table 1. Grey Fox Gold Resource, Including Gibson and GFS
Scope of 2024 and 2025 Drill Programs
Table 2. Drill Results Discussed in this Press Release
Geological Discussion of Recent Results
Gibson Expansion Zone
Figure 2. Gibson - 3D Section and Plan View
Grey Fox South Zone
Figure 3. GFS Zone Cross Section
Figure 4. GFS Zone Longitudinal Section
Updated Mineralization Model and Outlook for Grey Fox
Figure 5. 3D View of Updated Mineralization Model
Unless specified as core widths (CW), all assay intervals in this press release are presented as true widths (TW).
Figure 1. Plan View Map of Fox Complex Eastern Property, With the Zones Referenced in This Press Release
Grey Fox Gold Resource Overview
The Grey Fox deposit currently consists of six zones known as: Gibson, Grey Fox South (GFS), Whiskey Jack, Contact, 147 and 147 NE (see Figure 1).
Following the recent acquisition of the Stroud property, located Southwest of the Grey Fox deposit, we plan to incorporate it as the seventh resource zone into the overall Grey Fox resource base. The Stroud property hosts a historical resource, estimated at approximately 271,000 gold ounces that does not conform with current requirements under NI 43-101. To validate this resource, verification work is currently underway, including the relogging of historical drill core and drilling confirmation holes.
Within the current Grey Fox resource, the Gibson Zone accounts for approximately 19% of the Indicated resource and 53% of the Inferred resource. The GFS Zone accounts for about 12% of the Indicated resource, and about 11% of the Inferred resource (February 4, 2025 press release).
Table 1. Grey Fox Gold Resource, Including the Gibson and GFS Zones Contributions
|
Resource Area |
Indicated Grade (g/t Au) |
Indicated Gold (oz) |
% of Grey Fox Indicated Resource |
Inferred Grade (g/t Au) |
Inferred Gold (oz) |
% of Grey Fox Inferred Resource |
||
| Grey Fox | 3.64 | 1,538,000 |
100% |
3.30 | 458,000 |
100% |
||
| Gibson Zone |
2.91 | 290,000 | 19% |
2.94 | 245,000 | 53% |
||
| GFS Zone |
3.62 | 180,000 | 12% |
3.52 | 52,000 | 11% |
||
Scope of the 2024 and 2025 Exploration Drill Programs
The majority of the 2024 and 2025 drilling campaigns were designed with a focus on increasing the size of the resource base at Grey Fox and on upgrading the confidence of the gold resource from the Inferred to the Indicated category.
Drilling northwest of the historical Gibson Ramp has been a top priority for the Fox Complex Exploration Group, with some 20,000 meters drilled in H1 2025. The principal goal of this drilling program was to identify gold ounces close to the Gibson Ramp, which could provide near-term production during the early development phases of the Grey Fox Project.
A secondary focus for Grey Fox is the GFS Zone, which is discussed later in this press release.
These promising results reinforce our belief in the potential to further increase the Grey Fox resources. The Pre-feasibility Study (PFS) for Grey Fox is anticipated to be published in Q1 2026.
Table 2. Grey Fox Drill Results Discussed in this Press Release
| Hole ID |
From (m) |
To (m) |
Core Width (m) |
True Width (m) |
Au Grade (g/t) |
Figure Reference |
| 25GF-1549 | 63.8 | 64.8 | 1.0 | 0.8 | 18.2 | 3 |
| And | 444.0 | 452.0 | 8.0 | 6.0 | 4.4 | 3 |
| 25GF-1558 | 88.0 | 92.0 | 4.0 | 2.9 | 7.6 | 2 |
| 25GF-1560 | 329.0 | 330.0 | 1.0 | 0.9 | 44.7 | 2 |
| 25GF-1564 | 181.2 | 189.0 | 7.9 | 5.6 | 10.4 | 2 |
| And | 213.9 | 217.2 | 3.2 | 2.1 | 18.4 | 2 |
| 25GF-1575 | 275.7 | 290.8 | 15.1 | 14.9 | 4.8 | 3, 4 |
| 25GF-1582 | 372.0 | 374.8 | 2.8 | 2.4 | 15.2 | 3, 4 |
| 25GF-1585 | 122.3 | 123.0 | 0.8 | 0.1 | 64.8 | 2 |
| And | 157.2 | 157.9 | 0.7 | 0.2 | 124.7 | 2 |
| 25GF-1590 | 317.8 | 318.9 | 1.0 | 0.7 | 124.7 | 2 |
| 25GF-1594 | 113.3 | 116.4 | 3.1 | 2.3 | 11.1 | 2 |
| And | 171.0 | 179.0 | 8.0 | 5.8 | 5.3 | 2 |
| 25GF-1597 | 67.3 | 75.0 | 7.7 | 5.8 | 10.1 | 2 |
| And | 174.2 | 180.9 | 6.7 | 5.3 | 7.6 | 2 |
| 25GF-1599 | 232.0 | 238.0 | 6.0 | 4.7 | 3.9 | 2 |
| And | 423.0 | 451.0 | 28.0 | 21.6 | 2.0 | 2 |
| Including | 425.0 | 432.0 | 7.0 | 5.4 | 5.2 | 2 |
| 25GF-1605 | 39.0 | 40.0 | 1.0 | 0.8 | 46.4 | 2 |
| Previously Reported | ||||||
| 25GF-1528 | 46.0 | 59.0 | 13.0 | 10.5 | 5.5 | 2 |
| 25GF-1539 | 90.6 | 103.0 | 12.4 | 10.7 | 12.4 | 2 |
| Numbers may not sum due to rounding. | ||||||
For further information, a table of all drill results at Grey Fox from April 25th to August 5th, 2025 that includes hole locations and alignments is available on the Company’s website and can be accessed by clicking here.
Geological Discussion of Recent Results From the 2025 Grey Fox Drilling Campaign
Gibson Expansion Zone
Figure 2. Gibson - 3D Section (A-A’) Looking Northwest and Plan View Including Location of Section A-A’
Referring to the right-hand image in Figure 2, most of the intercepts reported here for the Gibson Zone are located North of the historical Gibson Ramp, in what is known as the Gibson Expansion Zone. Recent results include hole 25GF-1597, which graded 10.1 g/t gold over 5.8 m and hole 25GF-1564, which graded 10.4 g/t gold over 5.6 m. These results confirm the continuity of good grades and widths that were previously seen in this area, as in hole 25GF-1539, which graded 12.4 g/t gold over 10.7 m and hole 25GF-1528 which graded 5.5 g/t gold over 10.5 m (see press release from May 7, 2025).
Figure 2 illustrates that many of the higher-grade intercepts occur near the geological contact between the Gibson syenite intrusion (pink-colored unit) and sedimentary rocks (grey-colored unit). It is likely that this higher-grade gold mineralization is due to the rheological contrast (differences in rock hardness) between these two units, which is an ideal trap for mineralizing fluids and gold deposition.
This type of contact-related mineralization at Gibson also occurs at the Contact Zone (refer to the right side of Figure 2), where mineralization is hosted at the boundary between sediment (grey-colored unit) and mafic volcanic rocks (green-colored units).
The left side of Figure 2 shows a three-dimensional view (looking Northwest) for the Gibson area (A-A’ from the right side), demonstrating the proximity of higher-grade gold mineralization close to the geological contact between the Gibson syenite intrusion and sediments. For example, hole 25GF-1585 had two multi-ounce intercepts, 64.8 g/t gold over 0.8 m CW and 124.7 g/t gold over 0.2 m very proximal to that contact. It is noteworthy that there is little drilling Northwest of these two intercepts, near the contact between these two geologic units. In addition, the mineralization is open to the Northwest, which can also be seen on the right side of Figure 2. About 50% of the drilling planned for H2 2025 will take place at the Gibson Zone, including at the Gibson Expansion Zone, with the primary goal of quickly adding additional near-term gold ounces to the Grey Fox resource.
Grey Fox South Zone
Figure 3. GFS Zone Cross Section (B-B’) Looking Northeast, With Location Shown on Plan View Inset Map
The second major area of focus for exploration at Grey Fox is the GFS Zone. It is located Southeast of Gibson (refer to Figure 1). Figure 3 is a cross section (B-B’ on the inset map) looking Northeast through a portion of the GFS Zone. We are encouraged by the good grades and widths seen in Figure 3, such as hole 25GF-1575, which returned 4.8 g/t gold over 14.9 m. These grades are higher than the current resource grade at Grey Fox.
Figure 4. GFS Zone Longitudinal Section (C-C’) With Location Shown on Plan View Inset Map
Figure 4 is a longitudinal section (C-C’ on the inset map) which, along with hole 25GF-1582 that graded 15.2 g/t gold over 2.4 m, confirms the continuity of mineralization, remains open at depth and thus gives confidence that the gold resource within this area of the GFS Zone has the potential to grow.
Grey Fox: Updated Mineralization Model for Upcoming Resource Estimate and Growth Outlook
Figure 5. 3D View of Updated Mineralization Model at Grey Fox
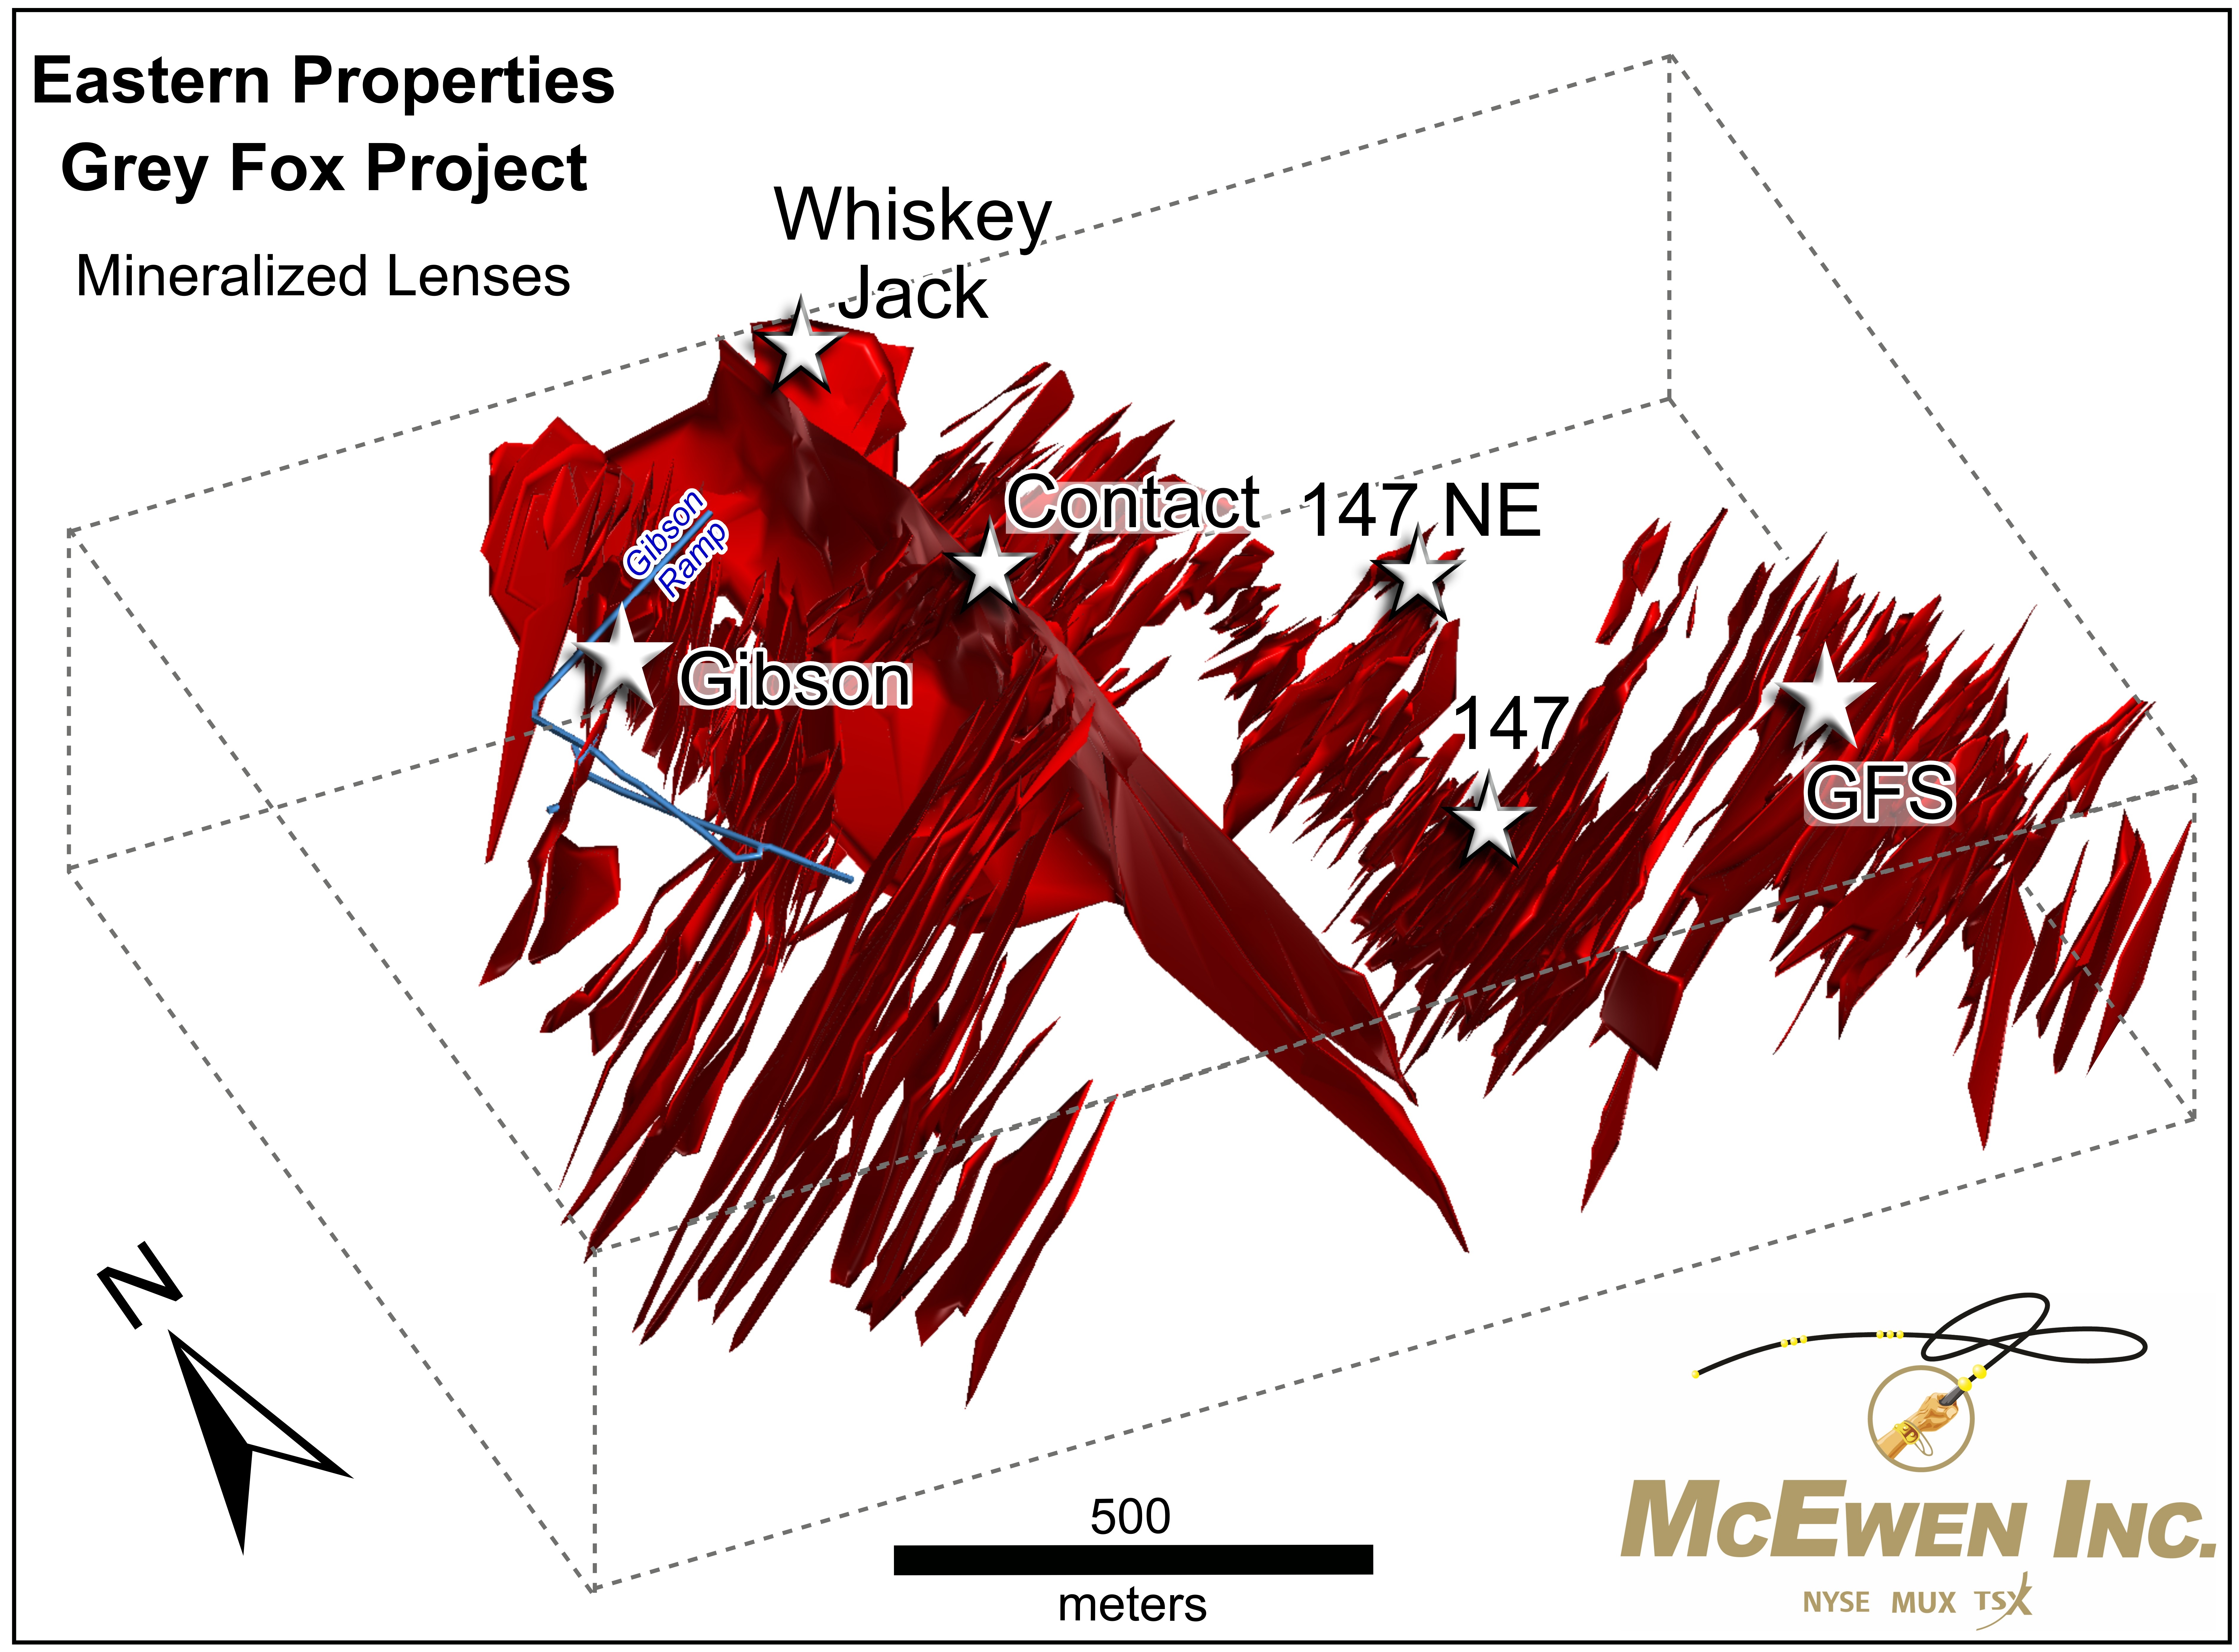
Figure 5 is a 3D view of the updated mineralization model for Grey Fox. Many of the new intercepts in this press release have been incorporated into this model, including the higher-grade results seen for the Gibson area described above. These results are expected to increase the estimated resource at Grey Fox, which is planned to be published next month.
As we continue to increase our geological understanding of the Grey Fox deposit through additional drilling and other exploration work, the Fox Complex Exploration Group is recognizing similarities with other large-scale deposits in the region. For example, both Grey Fox and the giant Canadian Malartic gold deposit (located near Val d’Or, Quebec), have similar gold-favorable geological characteristics and depositional environments. These similarities also reinforce our confidence that the resource at Grey Fox has potential for continued growth and further contribution to McEwen’s mining operations in Ontario.
Photos accompanying this announcement are available at
https://www.globenewswire.com/NewsRoom/AttachmentNg/3039f1a0-f937-4937-b809-8ec5d975df14
https://www.globenewswire.com/NewsRoom/AttachmentNg/96d35016-cd2d-452f-a73c-6ce92f347c94
https://www.globenewswire.com/NewsRoom/AttachmentNg/80d1cfc4-dd1c-4ee3-ad02-02be183b5d6b
https://www.globenewswire.com/NewsRoom/AttachmentNg/c67013cd-59cd-4ac9-8383-587d38cbe9e2
https://www.globenewswire.com/NewsRoom/AttachmentNg/e3983fb3-6673-44aa-b8ca-27742a6d6e5c

![]()
Figure 1. Plan View Map of Fox Complex Eastern Property, With the Zones Referenced in This Press Release
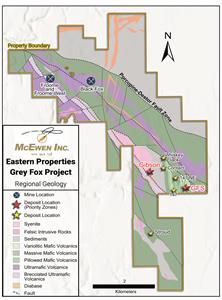
Figure 1. Plan View Map of Fox Complex Eastern Property, With the Zones Referenced in This Press Release
Figure 2. Gibson - 3D Section (A-A’) Looking Northwest and Plan View Including Location of Section A-A’

Figure 2. Gibson - 3D Section (A-A’) Looking Northwest and Plan View Including Location of Section A-A’
Figure 3. GFS Zone Cross Section (B-B’) Looking Northeast, With Location Shown on Plan View Inset Map
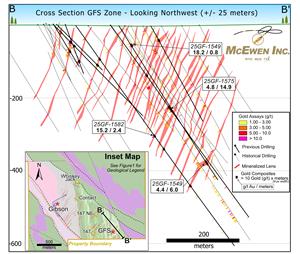
Figure 3. GFS Zone Cross Section (B-B’) Looking Northeast, With Location Shown on Plan View Inset Map
Figure 4. GFS Zone Longitudinal Section (C-C’) With Location Shown on Plan View Inset Map
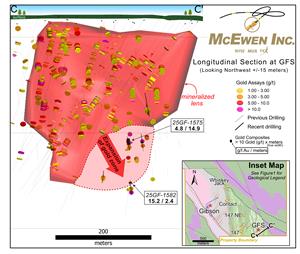
Figure 4. GFS Zone Longitudinal Section (C-C’) With Location Shown on Plan View Inset Map
Figure 5. 3D View of Updated Mineralization Model at Grey Fox

Figure 5. 3D View of Updated Mineralization Model at Grey Fox
Legal Disclaimer:
EIN Presswire provides this news content "as is" without warranty of any kind. We do not accept any responsibility or liability for the accuracy, content, images, videos, licenses, completeness, legality, or reliability of the information contained in this article. If you have any complaints or copyright issues related to this article, kindly contact the author above.
